Status panels (platform admin)
Every component the platform is made of, drawn as a diagram and coloured by health — where the admin banner sends you the moment anything goes amber or red. It lives under Admin → Status and requires the platform-admin role. Not to be confused with the public Platform status page, which answers "is the service up" for anyone, without an account; this one explains what to do about each red box.
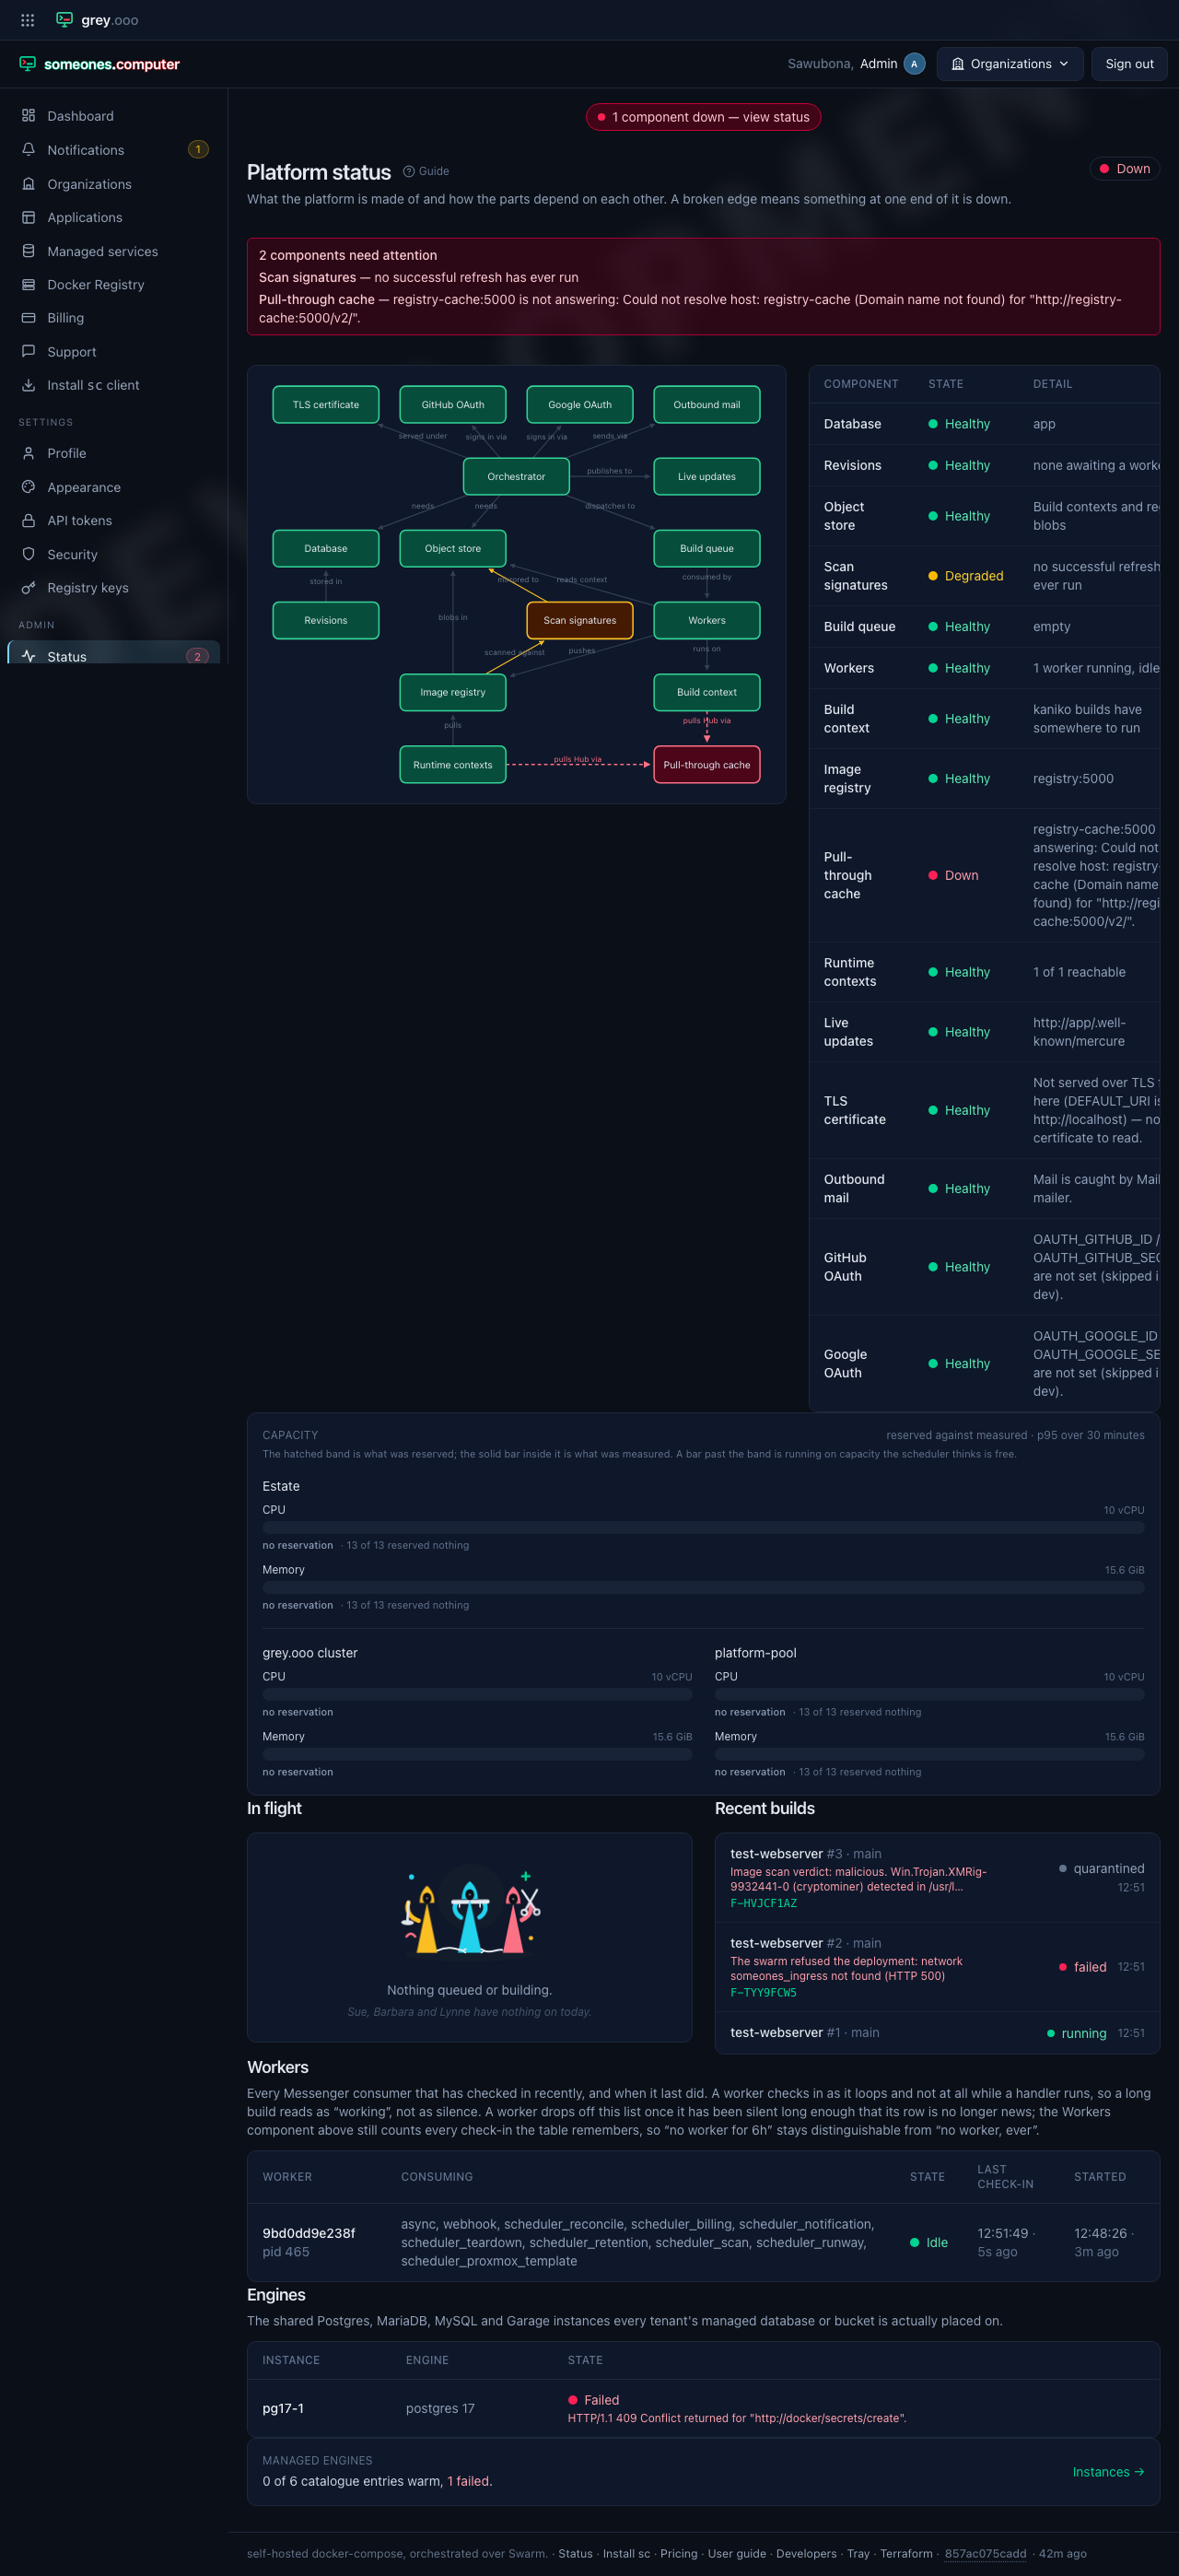
Four frames, each polling on its own schedule rather than one page refreshing as a whole:
| Panel | Polls | Reads |
|---|---|---|
| Health (the diagram) | Every 30s | A registry and object-store probe, cached for a minute — reloading the page is the only way to demand the truth this instant. |
| Capacity | Every 60s | Every context's running tasks and what they measured — moves on the reconcile cadence, not continuously. |
| Activity — in flight and recent builds | Pushed live over Mercure | Three indexed queries; the failure behind each recent row is one click away. |
| Workers | Every 15s | One indexed query — freshness is the entire point of a check-in. |
A broken edge means something at one end of it is down, not something wrong with the edge itself — the diagram draws dependencies, and reading it top-down traces a failure to its actual cause rather than the symptom the banner first showed.
A worker's row is its honesty, not just its pulse. Every Messenger consumer that has checked in recently is listed, with what it's currently consuming — a worker mid-handler still reads as "working," not silence, and one that drops off the list once its check-in goes stale enough is distinguishable from "no worker, ever" rather than collapsing into the same blank space.
Capacity draws what was reserved as a hatched band and what was actually measured as a solid bar inside it — a bar past the band is running on capacity the scheduler thinks is free, worth noticing before it becomes a placement failure.